


Families across the country are grappling with high housing cost burdens, and housing affordability challenges are felt most acutely by families with the lowest incomes and those with children. As communities consider opportunities to expand access to affordable housing, they should consider the specific needs of families with children. Families often consider many factors when looking for housing, including (1) availability, (2) affordability, (3) safety and quality, (4) community resources, and (5) whether the housing aligns with their needs. This brief largely focuses on the first and fifth factors: availability and whether housing meets families’ needs.
Low-Income Housing Tax Credit
Established in 1986, the Low-Income Housing Tax Credit (LIHTC) is the largest federal tax credit program focused on the production of affordable housing (e.g., no more than 30% of a household’s income for those earning approximately 60% of the area median income [AMI]). LIHTC-funded properties must set aside at least 20 percent of units for tenants earning no more than 50 percent of the AMI, or 40 percent of units must be occupied by tenants with incomes below 60 percent of AMI. Units may be occupied by tenants with incomes up to 80 percent of the AMI as long as the average income of the tenants of the occupied units does not exceed 60 percent of the AMI. The LIHTC is available to housing developers who agree to set aside a certain number of their housing units as affordable for a set period of time (usually 30 years).
As the nation’s largest affordable rental housing tax credit program focused on housing production, the Low-Income Housing Tax Credit (LIHTC; see box) provides an opportunity to address housing needs for families with children. This brief complements our previous analysis of affordable, available, and appropriately sized housing nationwide, exploring the extent to which LIHTC-financed housing is available—and suitable—for households with children and low incomes, taking into account the number of bedrooms each family needs. We use a series of figures to present data that highlight opportunities to leverage the LIHTC to increase the supply of affordable housing for families. Building on a line of existing work focused on affordable housing in New Jersey, we use this state as a case study example.
Methodology
Using 2022 American Community Survey (ACS) data, we identified New Jersey renter households with children under age 18 and incomes below 50 percent of the area median income (AMI)[1],[2]—a group likely eligible for LIHTC-financed housing. We estimated housing needs[3] using household size, assuming one bedroom per two coupled/partnered adults or one non-coupled/partnered adult, and one bedroom per two children. Zero- and one-bedroom units were considered too small for any family with children, based on HUD occupancy criteria. We then mapped the location and size of each LIHTC-financed unit across the state using U.S. Department of Housing and Urban Development (HUD) data and compared the availability of appropriately sized units to family housing needs in each county.
Findings
Heavily populated counties have more LIHTC-financed housing units.
Figure 1 illustrates the distribution of LIHTC-financed units across New Jersey counties by unit size. Essex County had the highest number of LIHTC-financed units (12,933), while Warren County had the fewest (10).
Counties with large cities—such as Essex (Newark), Camden (Camden city), Hudson (Jersey City), and Middlesex (New Brunswick)—have the highest number of LIHTC-financed units, reflecting greater population density and need. Less populated counties like Warren, Sussex, and Cape May have the fewest units.
Across nearly all counties, most LIHTC-financed units have zero or one bedrooms, suggesting that housing availability may be geared more toward individuals or small households rather than families. Larger units (three or more bedrooms) are less common, indicating a potential shortage of affordable housing for larger families.
Figure 1. The number of LIHTC-financed housing units in New Jersey varies widely by count
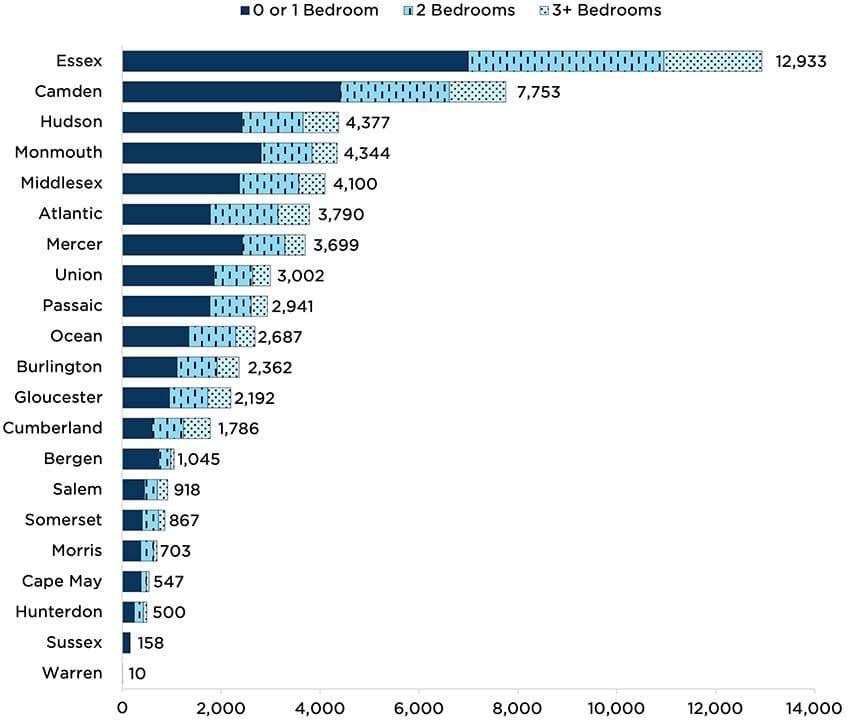
Source: U.S. Department of Housing and Urban Development (HUD) Low-Income Housing Tax Credit (LIHTC) database
Many LIHTC-financed housing units are too small for families with children.
Figure 2 shows the proportion of LIHTC-financed units in each New Jersy county by unit size, highlighting the availability of appropriately sized housing for families (number of bedrooms is demarcated using shades of blue). Units with zero bedrooms or one bedroom (gray) are considered too small for households with children. In Cape May County, for example, 71 percent of LIHTC units have at most one bedroom, while 19 percent have two bedrooms and 10 percent have three or more.
Small units make up a significant share of LIHTC-financed housing statewide. In every county but Warren, at least one third of units have zero or one bedrooms, and in 14 of 21 counties, these smaller units account for at least half of the total stock. This suggests a mismatch between available unit sizes and the needs of families.
Two-bedroom units represent 19 to 37 percent of LIHTC-financed units across New Jersey counties, with the highest shares—in Morris (37%) and Somerset (37%)—offering slightly better availability for small families. Larger units are consistently the least readily available, comprising just 10 to 31 percent of units in most counties. Exceptions include Warren County (100% with three or more bedrooms, although only 10 units total) and Sussex (0% having three or more bedrooms), highlighting a relative shortage of affordable housing for larger families statewide.
Counties like Essex (home to Newark) and Hudson (home to Jersey City) show more balance between unit sizes, while other counties exhibit less balanced distributions. For instance, Cape May (one of the state’s least populated counties) and Bergen (the state’s most populated county) have mostly zero- or one-bedroom units (71%), and just 29 percent have enough bedrooms for larger households (two or more).
Figure 2. In most New Jersey counties, at least one third of LIHTC-financed housing units are too small for households with any children
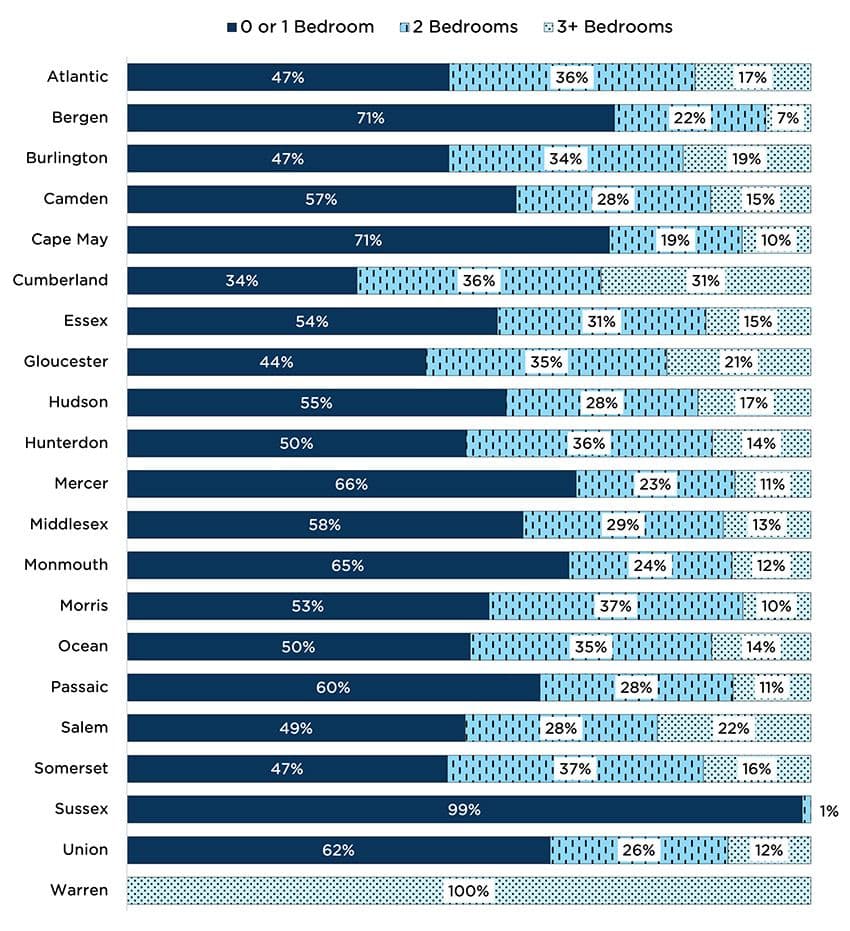
Source: U.S. Department of Housing and Urban Development (HUD) Low-Income Housing Tax Credit (LIHTC) database
Figure 3 displays the availability of LIHTC-financed units in New Jersey relative to potential need. Circles represent the number and location of LIHTC-financed units by number of bedrooms. The shading indicates the number of renter households with children and incomes below 50 percent of the AMI needing two-bedroom and three- (or more) bedroom units in each county, with darker shadings on the map representing areas of highest need. Larger circles indicate more units and darker shading reflects higher potential need.
In nearly every county, LIHTC-financed units with three or more bedrooms are more scarce than smaller units, despite high potential need. In Ocean County, for example, over 7,000 households with children and incomes below 50 percent of the AMI need a three-plus bedroom unit, yet only 389 LIHTC-financed units are available in that county. Meanwhile, the county has twice as many two-bedroom units available (949), despite a lower number of families who need a unit of that size (3,824).
Furthermore, although they are more widely available than three-plus bedroom units, two-bedroom units remain in short supply. In Mercer County, 5,705 renter households with children and incomes below 50 percent of the AMI need a two-bedroom unit, but fewer than 900 such LIHTC-financed units exist. Similarly, in Bergen County, just 231 LIHTC-financed two-bedroom units exist to serve 8,370 families (and other households without children) in need.
Some less populated counties, such as Hunterdon, Sussex, and Warren, have very few or no LIHTC-financed units, despite potential need. In contrast, counties like Hudson and Essex have higher concentrations of LIHTC units—yet potential need still outpaces supply.
These patterns highlight a statewide mismatch between LITHC-financed housing availability and the needs of households with children, particularly for larger households.
Figure 3. Distribution of LIHTC-financed housing units and housing needs of renter households with children and incomes below 50 percent of the AMI in New Jersey
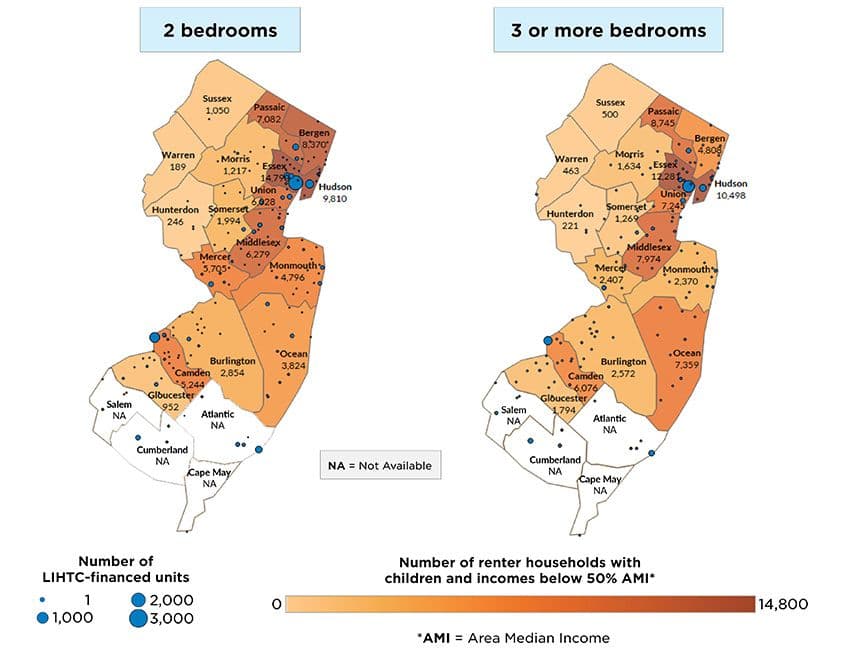
Sources: 2022 1-year American Community Survey (ACS) microdata from IPUMS USA, University of Minnesota & U.S. Department of Housing and Urban Development (HUD) Low-Income Housing Tax Credit (LIHTC) database
Note: Household need estimates are based on family sizes for households with children under age 18 and incomes below 50 percent of the area median income (AMI); see Table 1 for reliability of estimates.
NA = County-level population estimates were not available from the 2022 ACS data.
Our analysis highlights not only that a substantial portion of LIHTC-financed housing in New Jersey is not appropriately sized for families with children, but also that there is a mismatch between the distribution of available unit sizes and family needs, with fewer units for families that require three or more bedrooms. While LIHTC-financed housing is one way to increase the supply of affordable housing, there are opportunities to better match the supply of LIHTC-funded units with families’ needs.
Our findings emphasize the need for housing policies that consider whether available units meet families’ needs. Policymakers can use these data to:
- Better allocate housing resources by prioritizing the development of appropriately sized affordable housing
- Address geographic disparities by ensuring that LIHTC-funded developments are aligned with areas of greatest need
- Support funding and grant applications by using data-driven insights to advocate for increased investment in affordable and appropriately sized family housing
States and local governments can leverage these findings to inform future LIHTC allocation and ensure that housing developments provide safe, stable, and appropriate housing for families. If your state or locality is interested in similar analyses, please contact the authors for additional information.
Acknowledgements
This brief would not have been possible without generous contributions of time, resources, and thought partnership from a number of people. We want to thank Katie Richards for her careful review of our analytic code, as well as Christiana Adams, Constance Agbonlahor, Olanike Alli, Sydney Briggs, Kristen Harper, Dr. Chrishana M. Lloyd, Dr. Renee Ryberg, Jana’e Solomon, and Yolanda Stokes for their thoughtful review and guidance. Finally, this product would not have been possible without the Child Trends communications team, including Emily Baqir, Kelley Bennett, Brent Franklin, Matt Haugen, Olga Morales, Catherine Nichols, and Stephen Russ.
Appendix
The following table reports, by county, the supply (i.e., the number of LIHTC-financed units by size) and need (i.e., the number of renter households with incomes below 50% of the AMI in need of appropriately sized units) for affordable housing in New Jersey. We used the information in this table to populate Figures 1-3.
Suggested citation
Shaw, S., Gebhart, T., Thomson, D., & Yadatsu-Ekyalongo, Y. (2025). Using the Low-Income Housing Tax Credit to expand access to affordable housing for families. Child Trends. DOI: 10.56417/9139n5109w
Footnotes
[1] For urban areas, households were assigned Core-Based Statistical Area (CBSA) median incomes based on their Public Use Microdata Area (PUMA) classification, while non-urban households used state-level non-metro AMI without adjusting to the county level.
[2] We chose 50 percent of the AMI to conservatively estimate eligibility for LIHTC properties. Given this, our analysis likely underestimates how many households are eligible for LIHTC-funded units and thus overestimates the availability of units that may be occupied by tenants with incomes from 60-80 percent of the AMI.
[3] Please note, our analysis of need is focused on households with children—there are households without children who are also eligible for and occupy LIHTC-funded units.